Lake Tahoe & National Real Estate News
 RSS Feed
Subscribe and receive email notifications of new blog posts.
RSS Feed
EVENTS | 3 Posts
Lake Tahoe | 22 Posts
Luxury Real Estate | 15 Posts
Reno | 15 Posts
Uncategorized | 7 Posts
November
18
18
Recent South Lake Tahoe Home Sales Price/SF Stats
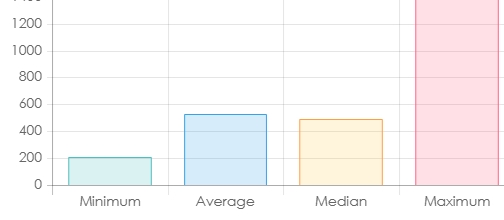
As of November 18th , above is an chart showing the price/sf for the South Lake Tahoe market. This is a snapshot of home/condo/townhome sales in the last three months. When you compare price/sf you are not comparing apples to apples. It tends to jump around depending on size, location, condition, supply and demand. It can help a seller price their home to be more competitive when looking at the median sales price. It can help buyers with using it as another comparison. The chart shows an average of $532/sf and a median of $493/sf.
What's Your Home Worth?
Check current market values for your home and view profiles of potential buyers.