Posts in category 'Uncategorized'
Subscribe and receive email notifications of new blog posts.
 RSS Feed
28
Lake Tahoe Real Estate Market Trend for February 2025
|

|
|

|
© 2024 Chase International. All rights are reserved by Chase International, and content may not be reproduced, downloaded, disseminated, published, or transferred in any form or by any means, except with the prior written permission of Chase International. All information is deemed reliable but is not guaranteed accurate.
|
18
Recent South Lake Tahoe Home Sales Price/SF Stats
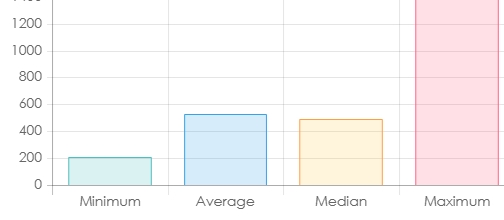
As of November 18th , above is an chart showing the price/sf for the South Lake Tahoe market. This is a snapshot of home/condo/townhome sales in the last three months. When you compare price/sf you are not comparing apples to apples. It tends to jump around depending on size, location, condition, supply and demand. It can help a seller price their home to be more competitive when looking at the median sales price. It can help buyers with using it as another comparison. The chart shows an average of $532/sf and a median of $493/sf.
15
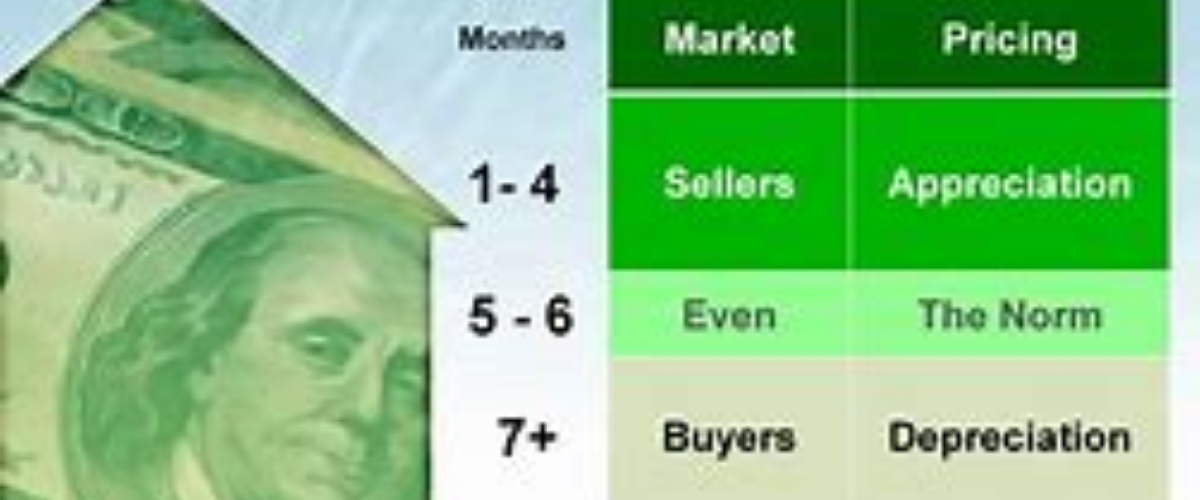
November 2024 Market Trend for Lake Tahoe Nevada East Shore
 As of November 14th Lake Tahoe on the Nevada east shore is showing a 6 months supply of homes/condo/townhomes on the market. This is calculated by dividing the number of properties that are currently on the market by the rate of pending sales in the past month. According to the chart above, this suggest a market that is in between a sellers and buyers market. I call it a tug of war. This may be a continuing trend through the rest of the month as sales are typically slower. For more market information and insights, send me an email to jwire@chaseinternational.com.
14
November 2024 Current Real Estate Market Trend for South Lake Tahoe
As of November 14th South Lake Tahoe is showing a 4.24 months supply of homes/condo/townhomes on the market. This is calculated by dividing the number of properties that are currently on the market by the rate of pending sales in the past month. According to the chart above, this suggest a sellers' market by a slim margin. This may be a continuing trend through the rest of the month as sales are typically slower. For more market information and insights, send me an email to jwire@chaseinternational.com.
13
Fire Adopted Communities at Lake Tahoe
Climate Change has put wildfire danger at the forefront of homeowners for the Lake Tahoe area. What can we do about it? Defensible space inspections have become a point of sale for many communities. Here is another piece that give homeowners more empowerment, Watch Video
What's Your Home Worth?
Check current market values for your home and view profiles of potential buyers.